|
| |
Financial Highlights
|
|
| |
|
|
|
| |
|
Turnover & Profit Before Tax [Consolidated] |
Rupees in Lakhs |
|
| |
|
|
|
| |
|
| Results of the Year |
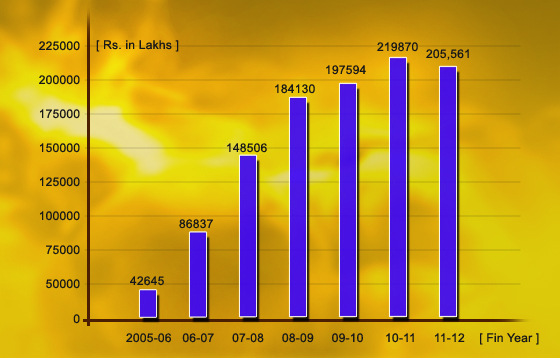
Total Sales |
Profit Before Tax |
| 2011 - 12 |
205,561.48 |
963.57 |
| 2010 - 11 |
219,870.25 |
9,479.99 |
| 2009 - 10 |
197,594.36 |
14,742.71 |
| 2008 - 09 |
184,130.75 |
11,097.56 |
| 2007 - 08 |
148,506.40 |
13,408.80 |
| 2006 - 07 |
86,837.10 |
6,416.00 |
| 2005 - 06 |
42,645.40 |
2,904.30 |
|
|
| |
|
|
|
| |
|
|
|
| |
|
Histogram on CCCL's Growth in Turnover |
|
| |
|
|
|
| |
|
 |
|
| |
|
|
|
| |
|
|
|
| |
|
Turnover & Profit Before Tax [CCCL Standalone] |
Rupees in Lakhs |
|
| |
|
|
|
| |
|
| Results of the Year |
Total Sales |
Profit Before Tax |
| 2011 - 12 |
201,012.47 |
1,393.80 |
| 2010 - 11 |
213,665.71 |
9,593.13 |
| 2009 - 10 |
195,004.35 |
14,807.46 |
| 2008 - 09 |
175,586.13 |
10,501.62 |
| 2007 - 08 |
144,809.06 |
13,135.91 |
| 2006 - 07 |
85,471.20 |
6,194.80 |
| 2005 - 06 |
42,645.40 |
2,904.30 |
|
|
| |
|
|
|
| |
|
|
|
| |
|
Consolidated Shareholding Pattern as on 31/03/2012 |
|
| |
|
|
|
| |
|
| Category |
No. of Holders |
Total Shares |
% To Equity |
| PROMOTERS |
7 |
83154133 |
45.002371% |
| BODIES CORPORATES |
301 |
27680949 |
14.980715% |
| RESIDENT INDIVIDUALS |
16670 |
25669430 |
13.892096% |
| FOREIGN INSTITUTIONAL INVESTORS |
15 |
16392249 |
8.871358% |
| PROMOTER GROUP |
12 |
10653405 |
5.765540% |
| MUTUAL FUNDS |
9 |
10275361 |
5.560946% |
| FOREIGN CORPORATE BODIES |
1 |
7126722 |
3.856927% |
| NON RESIDENT INDIANS |
215 |
1721244 |
0.931524% |
| TRUSTS |
2 |
1064285 |
0.575983% |
| H U F |
976 |
510783 |
0.276432% |
| CLEARING MEMBERS |
28 |
423084 |
0.228970% |
| INDIAN FINANCIAL INSTITUTIONS |
2 |
104500 |
0.056555% |
| BANKS |
2 |
1080 |
0.000584% |
| Total |
18240 |
184777225 |
100.00% |
|
|
| |
|
|
|
|
|
|